
The steps to create a report in the BI Tool are not rigid. As you become familiar with the process, you may develop your own system. As a guideline, though, these instructions will outline the steps needed to create a report.
The areas that assist in creating a report include:
•Configuration/Data Sources(BI Tool Configuration/Data Sources) - This screen is where you name the report, enter a description, establish the type of report, can establish whether this report is to be the “default report” and, most importantly, establish the Data Source for this report. Color Theme can also be established.
•Dashboard/Report Edit (BI Tool Dashboard/Report Edit)- This screen assists by offering opportunities to refine Main Level Settings (also available on Data Sources screen), choose Component types, and set graph placement.
•BI Tool Navigating Reports - Refer to this section for more information on using Date Range, Details settings, Grouping, Sorting, Filtering, etc.
The following should be considered the basic steps needed to create a report in the BI Tool. Following this list are the details for each step.
1. Click Add Report icon on header.
2. Enter a Report Name and choose report Type.
3. Click + to add a Data Source.
4. Enter DS Name (which is the Data Source Name).
5. Choose a Business Category.
6. Choose a Main Category, which is called a “view.”
7. From the side arrow beside Main Category, choose Date Range and enter the range.
8. Click checkmark on Data Sources screen to establish and save that Data Source.
9. Click checkmark on Configuration/Data Sources screen to save Report Name, Type, Data Source, and any other options entered.
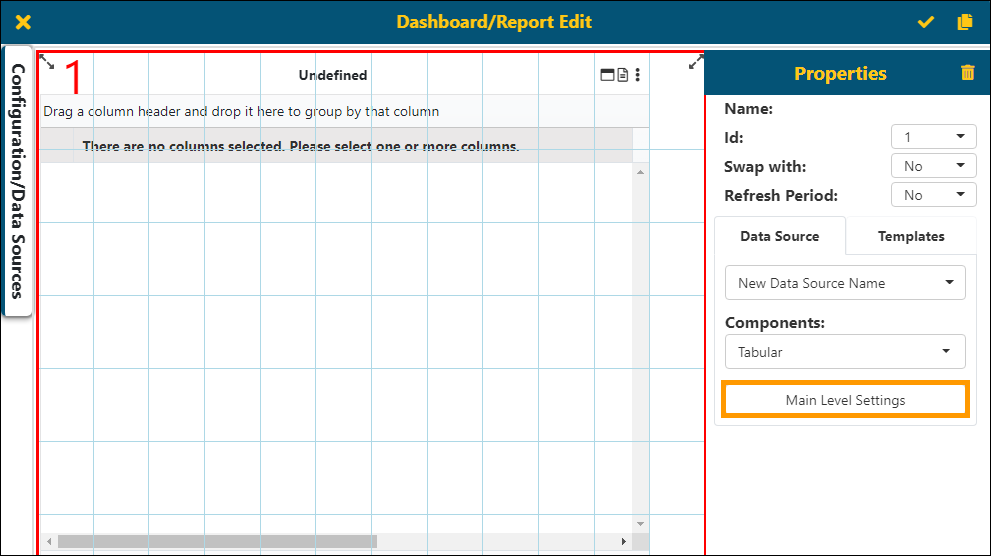
10. On the Dashboard/Report Edit screen, click Main Level Settings. Choose the columns needed for this report by clicking the “visible” box to include that filter. Choose as many as needed for that report.
11. Use Grouping, Sorting or Summarize tabs to organize the data in the report.
12. Click checkmark on Dashboard/Report Edit screen to save this report.
|
STEP 1: |
Click Add Report icon on header |
From the header, click the Add Report icon to create a new report.

Figure 45: Add Report icon on the header
|
STEP 2: |
Enter a Report Name and choose report Type |
From Configuration/Data Sources, enter a Report Name and Type.
Type refers to the folder where the report will be stored in the Report Listing. The options available under the Type dropdown only include the folders created under Settings > Administration > My Reports or Public Report. (See BI Tool Public Reports and My Reports for additional information.) Also, notice Configuration/Data Sources is a sub header on the screen named Dashboard/Report Edit. Dashboard/Report Edit is the main screen used to create or edit reports. (See BI Tool Dashboard/Report Edit for additional information.) More information on the Configuration/Data Sources screen is detailed under BI Tool Configuration/Data Sources.
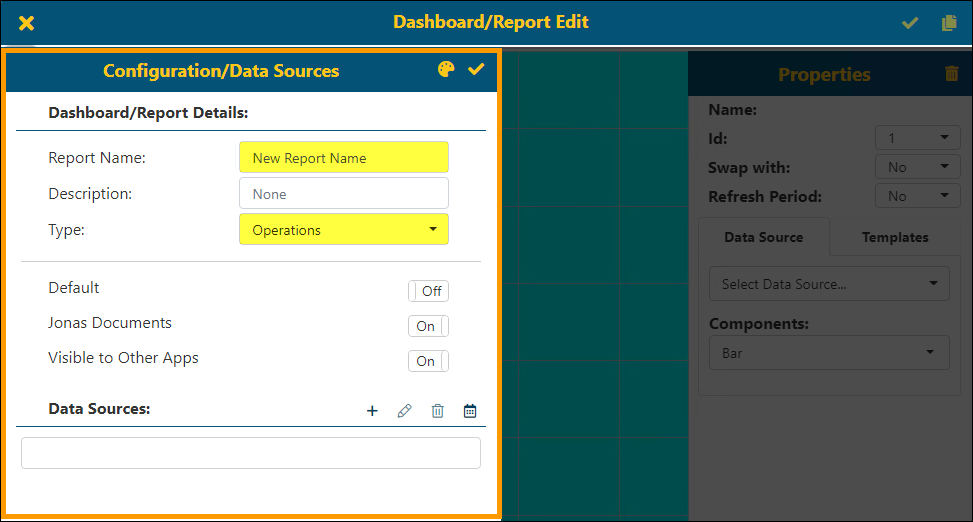
Figure 46: Configuration/Data Sources screen
|
Click + to add a Data Source |
Under Data Sources, click the Add icon to choose the data source (or group of information) that will be used to create this report.
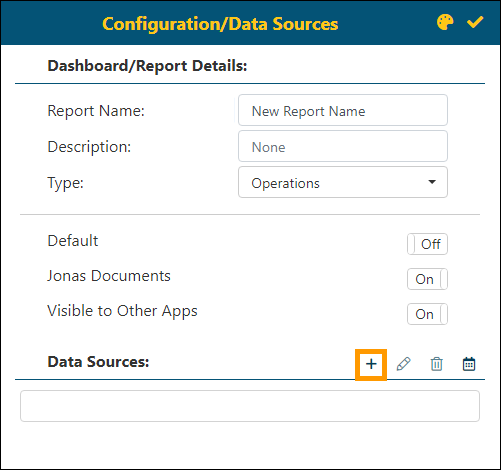
Figure 47: Add a data source to this report
|
STEP 4: |
Name the Data Source |
Enter a name for the data source in DS Name. “DS Name” is the abbreviated version for the expanded name “Data Source Name”.
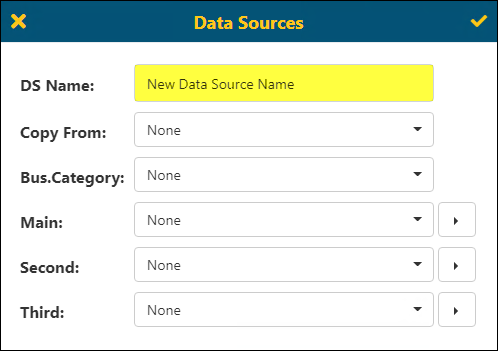
Figure 48: Enter a name under DS Name
|
Choose a Business Category |
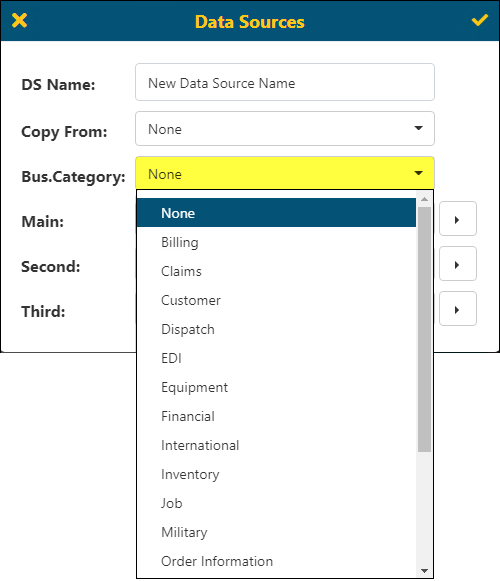
From the dropdown, choose a category under Bus.Category. “Bus.Category” is the abbreviated version for the expanded name “Business Category”.
|
STEP 6: |
Choose a Main Category |
From the dropdown, choose an option under Main. The options available will depend on what is chosen for the Business Category.
Important: The options listed under Main are called “Views”. A “view” is a group of like data collated to assist in the creation of your report. The views available for the Business Category Billing include Quote Summary, Retained Revenue, Revenue Entry and Revenue Entry Revenue Only, which are the options available under Main.
TIP: If you are unsure of which option contains the data you need, choose your best-guess. From the side arrow, choose Filters. Scroll through the list to see if the information you need is in this view. If it isn’t, choose another Main option and again check the Filter to see if the data you need is included.
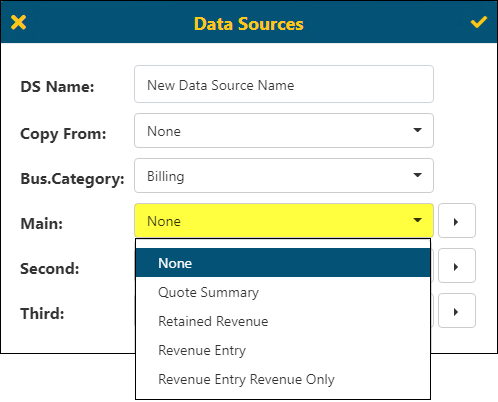
Figure 49: Options available under Main are dependent on what is chosen for Bus.Category
|
STEP 7: |
Click options arrow from Main Category. Choose Date Range and enter the range |
To the right of the Main option is a side arrow which prompt options available to further refine the data needed to create this report. Choose Date Range and enter a date range. Details on choosing a date range are detailed in Date Range (See BI Tool Date Range).
IMPORTANT: It must be noted that the Filters and Date Range options are the most useful tools to refine the data for your report. Without using these options, the data included in this report would be all the data, from all the filters, for all the dates included in your database for MoversSuite. If your company has been using MoversSuite for ten years, it would include all the data included in the Main view for the ten years. Details on using the options are available in BI Tool Navigating Reports.
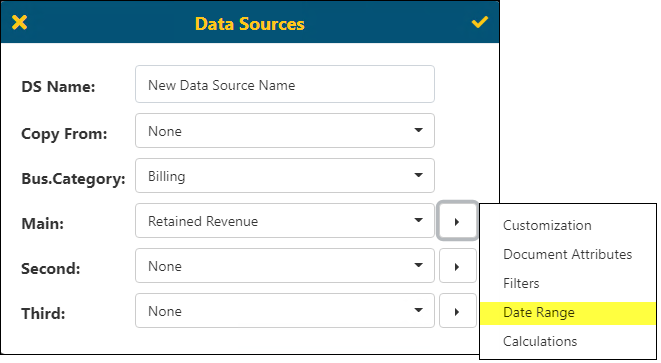
Figure 50: Date Range option
|
STEP 8: |
Click checkmark on Data Sources screen to establish and save that Data Source |
Clicking the checkmark saves the parameters set for this data source just created. The parameters at this point include DS Name, Bus.Category, Main and Date Range.
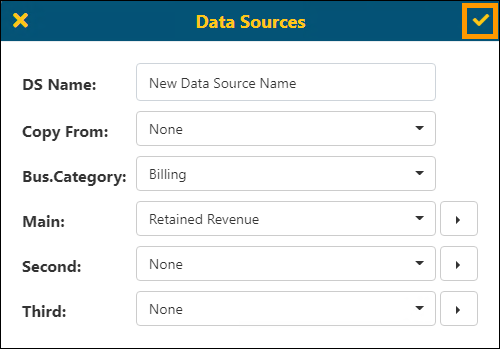
Figure 51: Save this Data Source
|
STEP 9: |
Click checkmark on Configuration/Data Sources screen to save. |
Notice the Data Source just created is listed as the data source on the Configuration/Data Sources screen. This screen now contains the Report Name, the Type, and the data source set for this report. Clicking the checkmark saves this information on the Configuration/Data Sources screen only. To reinforce that this is saving the Configuration/Data Sources information only, the checkmark is greyed on the Dashboard/Report Edit screen.
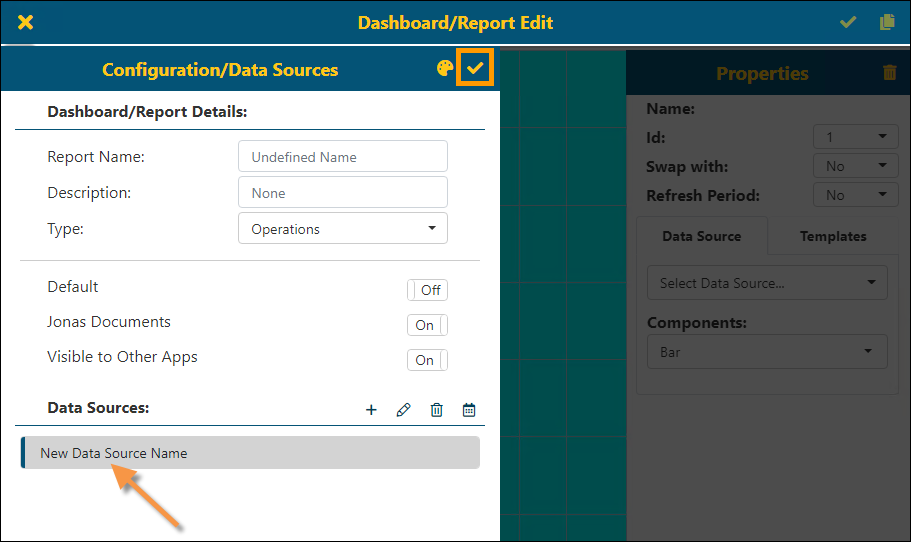
Figure 52: Information is set on Configurations/Data Sources
|
STEP 10: |
Click Main Level Settings to choose the columns needed for this report. |
Saving the Configuration/Data Sources information reveals the Dashboard/Report Edit screen. Click Main Level Settings to access the listing of the columns available for the report. Remember that the options include what was set on Business Category and Main for your data source.
TIP: The data source can be changed by clicking on the Configuration/Data Sources white tab on the left of the screen. This takes you back to Configuration/Data Sources. From the Data Sources section, click the pen to edit the data source listed. Simply change any of the information you need and save. Click the checkmark on the Configuration/Data Source screen to save. This returns to the Dashboard/Report Edit screen as shown in this step in these instructions.
From the Main Level Settings screen, click the box under Visible to include that information as a column in this report. Enter a search in the highlighted field shown (Figure 53) to assist in finding the information you need. Click on a field and use the arrow up/arrow down buttons to arrange the order of the chosen columns.
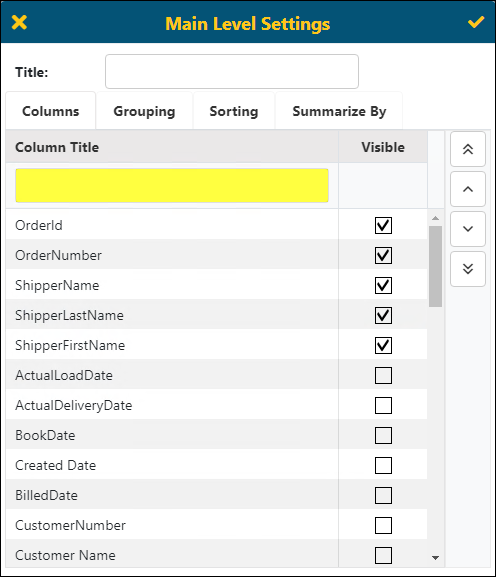
Figure 53: Choose columns for your report
|
STEP 11: |
Use Grouping, Sorting or Summarize tabs to organize the data in the report. |
Use of these tabs is detailed in BI Tool Details Settings and BI Tool Columns Grouping Sorting and Summarize By.
|
STEP 12: |
Click checkmark on Dashboard/Report Edit screen to save this report |
To save this report, click the checkmark on the Dashboard/Report Edit screen. Remember that all the data set in the report can be edited and saved.
IMPORTANT: Information within the report can be manipulated without harm to parameters set for this report. Feel free to play with report and its settings and be sure to use the X to exit. Using the X to exit will not permanent change the content of the report. If you do wish to keep any changes, click the checkmark and it will be saved. See BI Tool Edit a Report for more information.
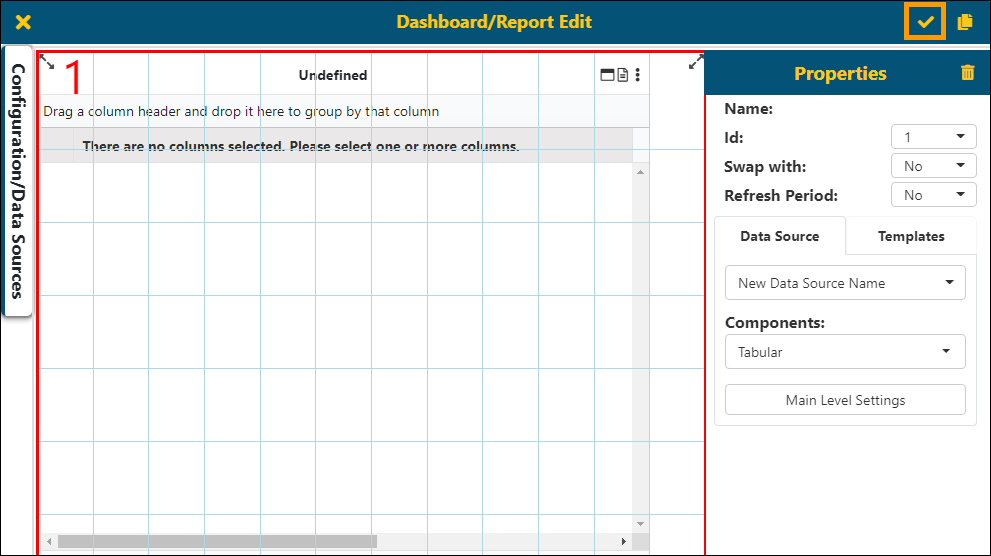
Figure 54: Dashboard/Report Edit screen