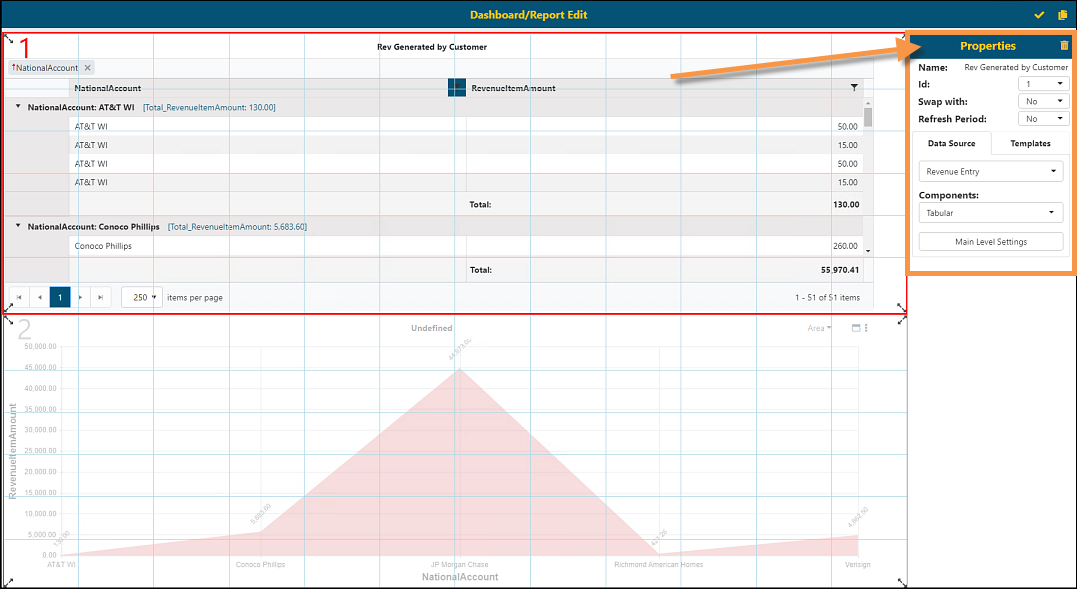
The Properties screen is located on the Dashboard/Reports Edit screen (outlined in orange in Figure 72). The Properties screen is used to choose the data that is used in the report, organize the report, and organize the data within the report. Edits can be made to the Data Source of the report as detailed in

Figure 72: Properties screen
The fields and their description include:
|
Field |
Description |
|
Name: |
This is the name of Data Source being used for this report. See BI Tool Data Sources for more information. |
|
Id: |
This is used to identify the area of the BI Tool Dashboard/Report Placement if more than one is being used. The area being used will be indicated by being outlined in red with a large number on that area. That number is the one identified in this field. In the example below, the number 1 is in red; therefore, the ID number will be 1. The parameters set on the Properties screen will be for ID number 1.
|
|
Swap with: |
Choosing another component on the dashboard would allow the user to swap components with the selected component or Id to move each component to another place on the dashboard. |
|
Refresh Period: |
User can set a time to refresh=h this component within the dashboard. |
|
Data Source Tab | |
|
Data Source: |
|
|
Components: |
Select the report (tabular or matrix), graphical, radial or web link component. Each of these components are described in detail in next section. See BI Tool Components for details. |
|
Template | |
|
This tab allows the ability to copy a component from one dashboard to another. | |
|
|
Add a template that can be copied into another dashboard by clicking this Add icon. |
|
|
Select a spot on the dashboard and click Apply icon to copy in Component (and will automatically copy Configuration as well as Settings) |
|
|
The Delete icon will delete template from list to reduce clutter of components available to copy. |
To further explain the ID field, in Figure 72 there are two components on the Dashboard/Report Placement area. One component is placed above the other and each area is numbered with the numbers 1 or 2. As area 1 is highlighted in red, that is the area indicated on the Properties screen in the ID field. Notice “1” is listed. Should area 2 be highlighted (by being clicked on and then outlined in red), the ID number in the Properties screen field would indicate 2.
NOTE: The remaining fields and information in use on the Properties screen are specific to the ID area identified in the ID number field only.