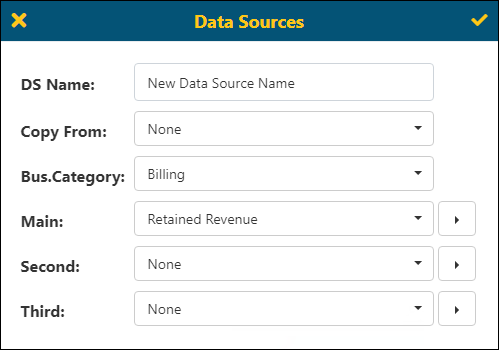
The Data Source is the information that is used in the report. The Data Sources screen is where you establish the name of this data source, the Business Category for the information needed for this report, the View for the report, and any further parameters the user sets for this data source for this report being created or edited. See BI Tool Create a Report.

Figure 57: Data Sources screen
When creating or editing a report, the Data Sources screen can be accessed from:
•Configuration/Data Sources (BI Tool Configuration/Data Sources) screen by click the Add or the Edit icon under Data Sources
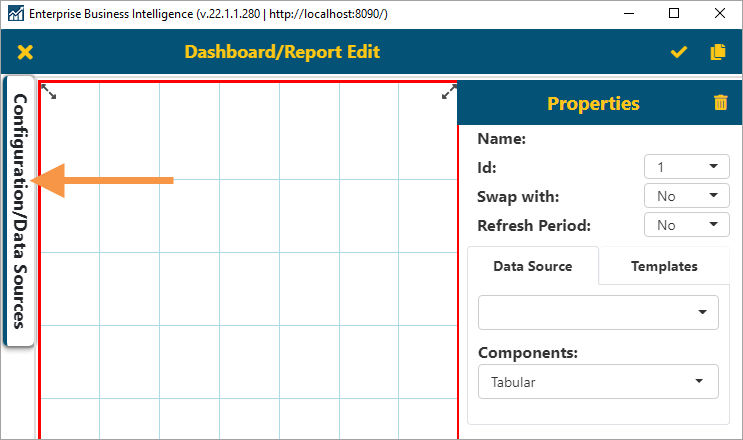
•Dashboard/Report Edit (BI Tool Dashboard/Report Edit) by clicking the Configuration/Data Sources tab on the left of the screen (Figure 58).

Figure 58: Click this tab to go to Configuration/Data Sources
To create a report (as detailed in BI Tool Create a Report), these are the five parameters needed within Data Sources to establish a simple and highly functional report:
•DS Name
•Bus.Category
•Main
•Main > Date Range
•Main > Filters
There are more parameters that can be set, of course; however, these five are a great place to start.
The following table describes the details of the Data Sources screen:
|
Icon / Field |
Function |
|
|
Exit icon Click the Exit icon to exit the Data Source screen without saving any changes. You will return to the Configuration/Data Sources screen. |
|
|
Save icon Click the Save icon to saving any changes made and exit the Data Sources screen. You will return to the Configuration/Data Sources screen. |
|
DS Name |
This the name of the Data Source that is being created for this report. Once saved, this will be the name that lists under Data Sources on the BI Tool Configuration/Data Sources screen. |
|
Copy From |
This will be available if a user is Adding a Data Source and wants to copy from an existing Data Source in this report/dashboard.
NOTE: This is helpful when in situations where I want multiple reports/dashboards based on the same data but with a different filter or date range for example.
|
|
Bus. Category |
This is an abbreviation for “Business Category.” Use the dropdown to choose the category for this report. The category chosen will determine the options available under Main. See BI Tool Business Category for additional information. |
|
Main
|
Use the dropdown to choose a View within Main. This View will be the Data Source in this report. This setting corresponds to the Main Level Setting button found on the BI Tool Dashboard/Report Edit > BI Tool Properties screen. |
|
Second |
The options available within Second, if any, are dependent on what is chosen for Bus. Category and Main. This setting corresponds to the Second Level Setting button found on the BI Tool Dashboard/Report Edit > BI Tool Properties screen, which only shows if an option is set here.
Choosing a Second and Third is relevant when building a Tabular Drill Down Report OR to see a drilldown through the Details when clicking into a matrix, chart, gauge, top list, or stock ticker.
Second, when set under Data Sources, will not be included in exports. |
|
Third |
The options available within Second, if any, are dependent on what is chosen for Bus. Category, Main, and Second. This setting corresponds to the Third Level Setting button found on the BI Tool Dashboard/Report Edit > BI Tool Properties screen, which only shows if an option is set here.
Choosing a Second and Third is relevant when building a Tabular Drill Down Report OR to see a drilldown through the Details when clicking into a matrix, chart, gauge, top list, or stock ticker.
Third, when set under Data Sources, will not be included in exports. |
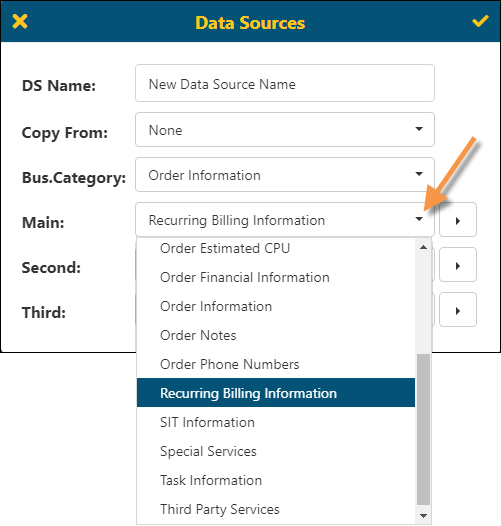
Bus.Category (or Business Category) defines the type of information to be used for the report. Main is a subcategory, and the options listed are called “Views.” A view is a pre-defined group of information that is similar within that business category. Views help you to create a report more easily. Instead of choosing filters from all the data within MoversSuite, the view has narrowed down the information to what is relevant for that type of report. In the example shown in Figure 59, the Business Category is Order Information; therefore, the options available under Main include view relevant to that category.

Figure 59: The options available under Main depend on what business category is set
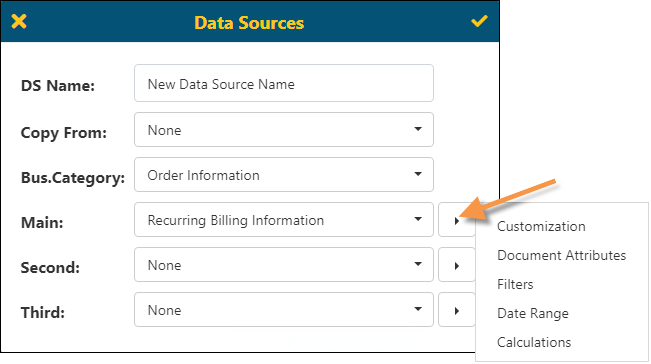
From Main, choose from the side arrow dropdowns indicated to access further options, i.e., Customization, Document Attributes, etc. for the Main subcategory. For more information on these options, see: BI Tool Customization, BI Tool Document Attributes, BI Tool Filters, BI Tool Date Range and BI Tool Calculations.

Figure 60: Click the side arrow to show these options