
Dashboard/Report Edit > Properties > Template tab
Templates are reports that have been saved in the Templates Library. The benefit of using templates is that the BI Tool Data Sources and settings are saved within each template; however, the BI Tool Data Sources and settings can be edited when used. Templates can be used alone or in combination with other templates, added to existing reports, or used when creating a new report.
NOTE: Due to the endless possibilities of layouts, the number of templates used, etc., these are general instructions.
These instructions are for creating a dashboard, which will use multiple reports. To create a new report that uses one or two templates, these instructions will show you that as well. The instructions are:
1. From the homepage, click the Add Report icon (+).
2. Enter a Report Name and Type. Save.
3. Click on a template to be used.
4. Optionally, change the data into a chart, if needed.
5. Resize the area.
6. Repeat Steps 3 and 4 as needed.
7. Save.
STEP 1: Click Add Report icon on header.
From the header, click the Add Report icon to create a new report.

STEP 2: Click Add Report icon on header.
From the BI Tool Configuration/Data Sources screen, enter a Report Name and Type. Then click the checkmark to save. Data Sources do not have to be added if using just existing Templates. If needed, a Data Source can be entered as detailed within BI Tool Create a Report.
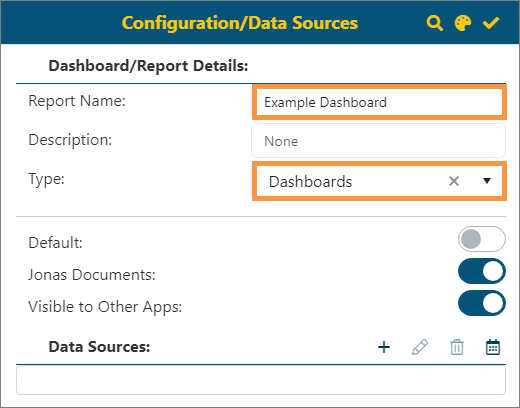
STEP 3: Choose a template.
Setup Area: BI Tool Dashboard/Report Edit screen > BI Tool Properties > Template tab
From the Properties screen, click the “Templates” tab. Choose a template and click the name to highlight the item. Click the checkmark to add that template to the BI Tool Dashboard/Report Placement screen.
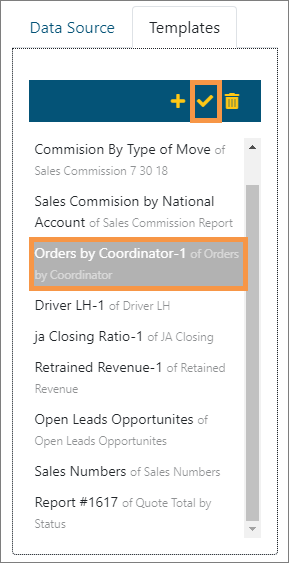
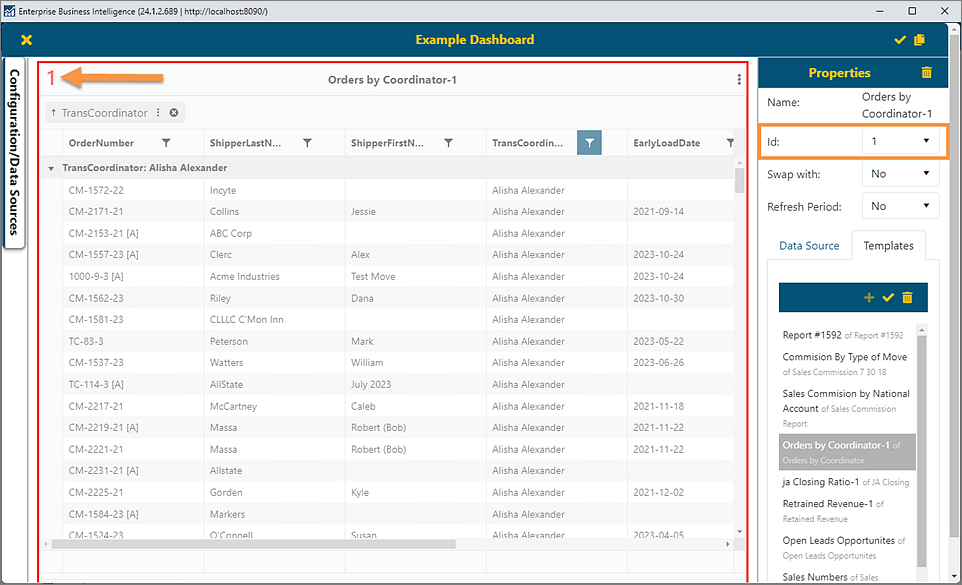
When the checkmark is clicked, the template will be added to the BI Tool Dashboard/Report Placement screen. Notice the red “1” in the upper left corner. This number corresponds to the “Id:” field under Properties, which is shown in the image below. Note that the template takes up the entire placement area.
STEP 4: Optional: Change the format into a graph.
Setup Area: BI Tool Properties
Notice the information in Area 1 is not very helpful for a Dashboard. If needed and optionally, change the information’s format by using the BI Tool Components section found within BI Tool Properties. TO do so, click the area, in this case Area 1 to have it outlined in red. This denotes the “active” area in the BI Tool Properties screen. Choose the Data Sources tab. In this example, the Components type is set to Column in Figure 105. The column’s parameters were set by clicking Column Chart Setting and set as shown in Figure 106.
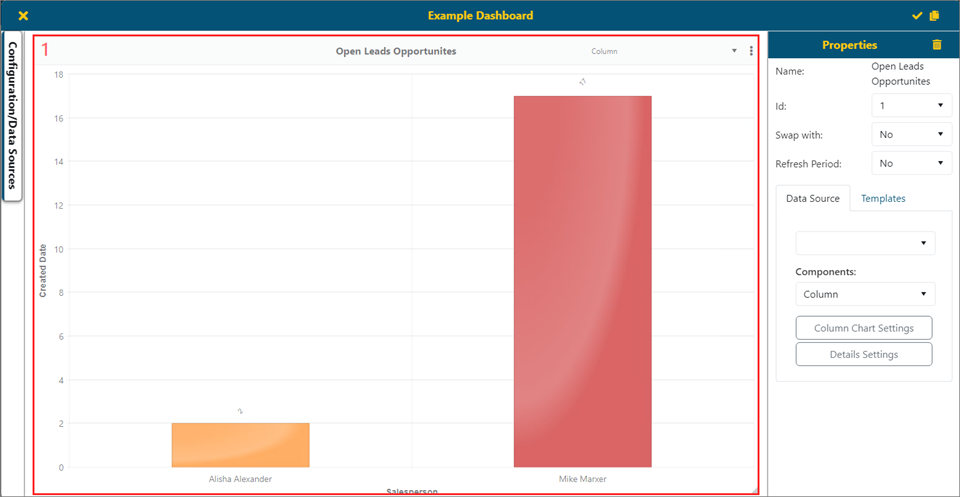
Figure 105: Area 1 was changed into a Column Chart using Components.
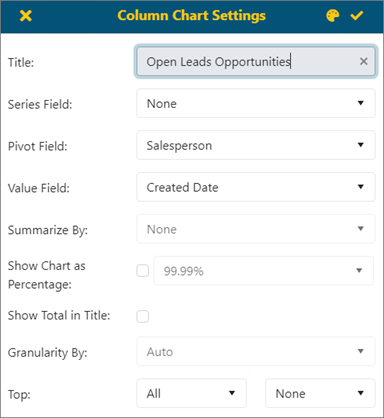
Figure 106: Column Chart Settings used for Area 1.
STEP 5: Resize the area.
Setup Area: BI Tool Dashboard/Report Placement
To make room for another template on the BI Tool Dashboard/Report Placement screen, click an edge of the area named #1 and drag to resize the field. If the bottom area is “off the screen,” click the top edge and scroll down. Then, to move the area, click the header and drag to anywhere within the placement area grid.
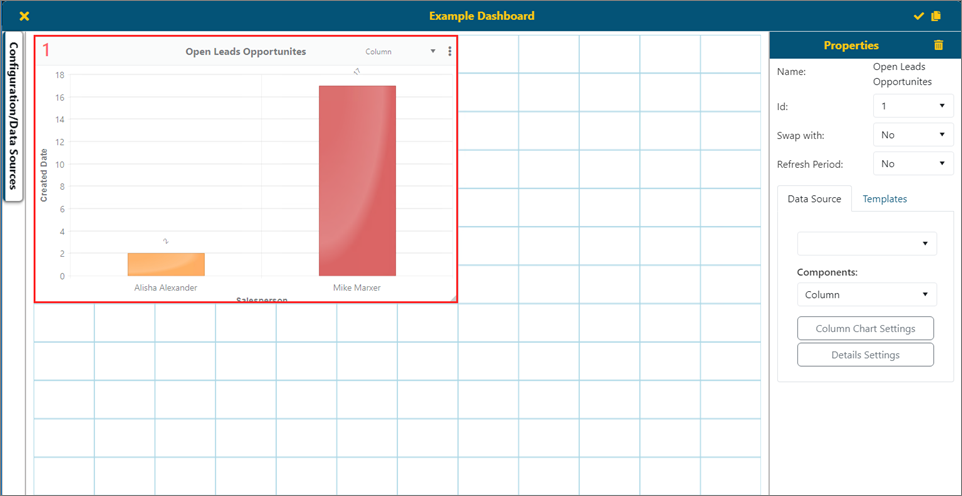
STEP 5: Choose where to put the next template.
Click your mouse somewhere in the open part of the screen and drag to create designate the area for the next template. When creating a new area, the area of the grid will turn grey. When completed, the area will have a red two in the upper left corner of that space and the space will be outlined in red. Since the area is outlined in red, it is the “active” area so the Properties screen reflects information set. Notice also that Id: show 2.
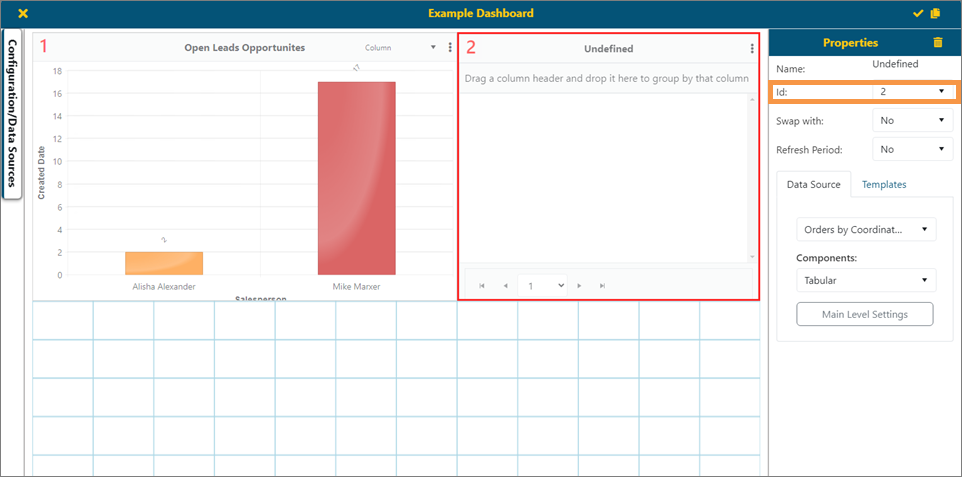
STEP 5: Choose another template.
With the space still outlined in red, select another Template and then click the checkmark to add that template to that area in the BI Tool Dashboard/Report Placement screen.
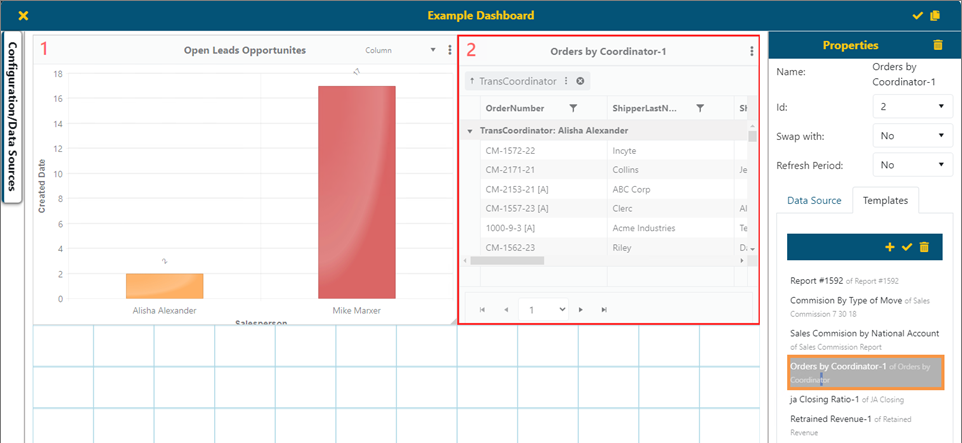
Figure 107: A template is chosen for Area 2.
From BI Tool Properties > BI Tool Data Sources, use BI Tool Components to put the data into a graph as shown in Step 4.
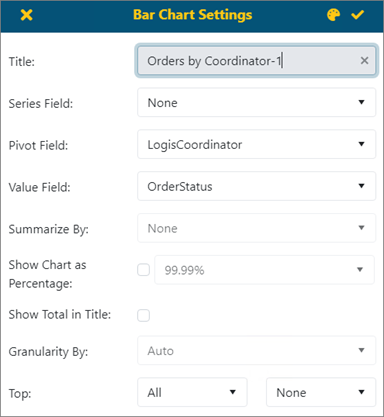
Figure 108: Bar Chart Setting used in example.
After saving the Bar Chart Setting, the BI Tool Dashboard/Report Placement area look like the image below:
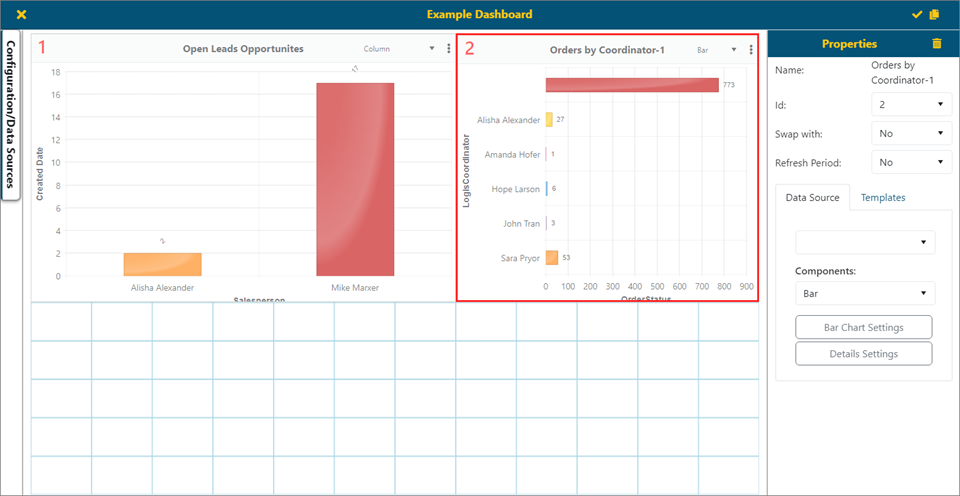
Keeping in mind the space available for a dashboard on your screen and reducing report sizes may render some data less readable, repeat Steps 4 and 5 as desired.
Area 3 used the following:
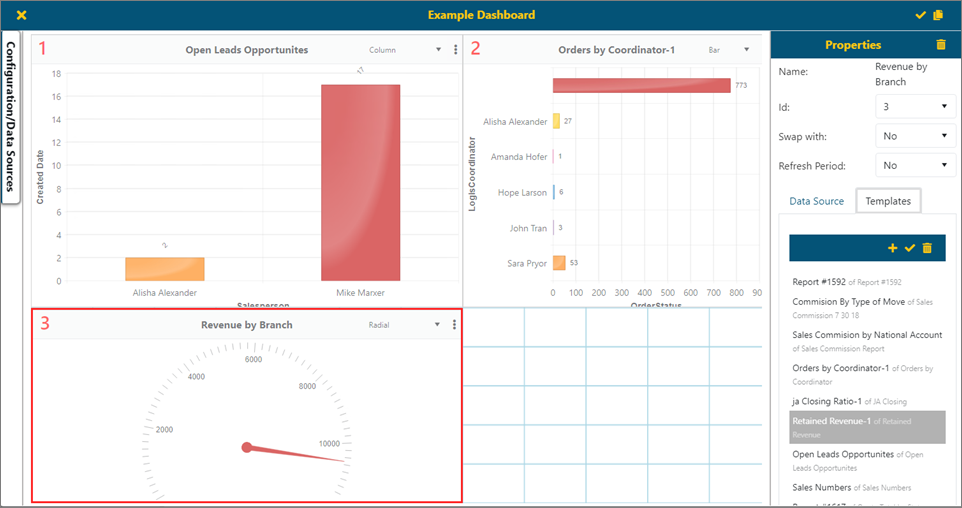
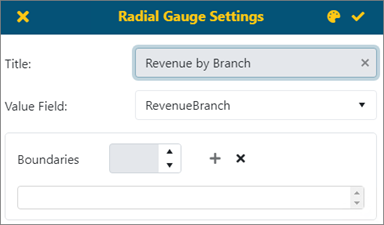
STEP 7: Rearrange Areas if needed.
These are the areas desired for the Dashboard; however, using these graphs, the layout can be improved. In this example, Area 2 and Area 3 are to be swapped. As Area 3 is outlined in red, it is “active” so the Properties screen reflects that area’s information. Using the “Swap with” field, enter 2. This will swap Area 3’s placement with Area’s 2. After the swap, the “new” Area 3 was resized to better utilize the area.
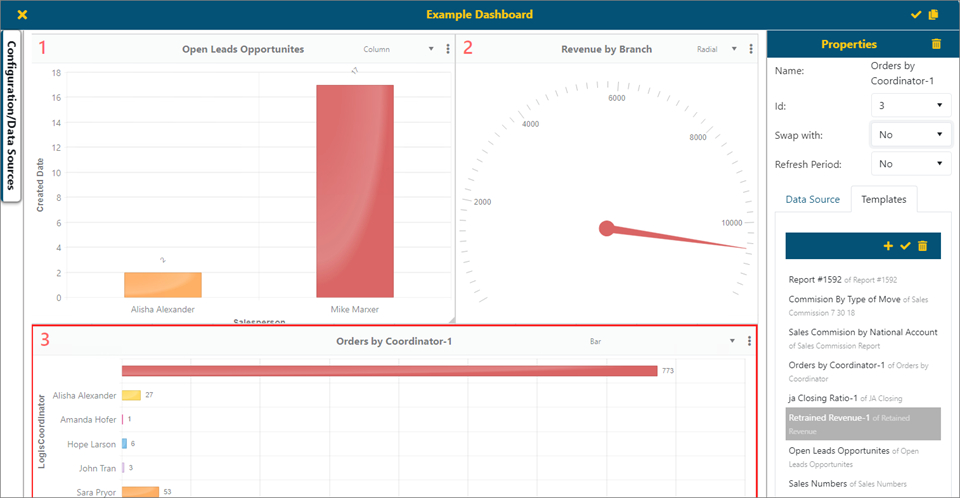
STEP 8: Save
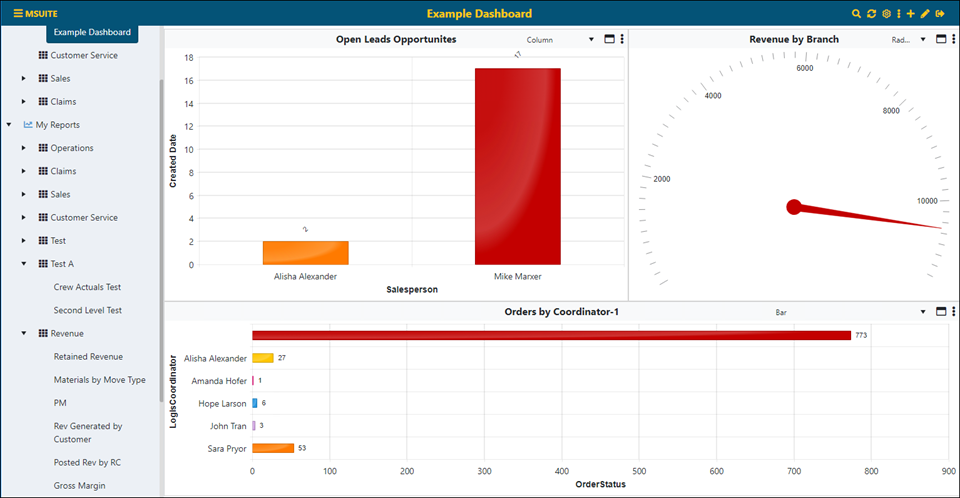
Click the checkmark in the upper right corner of the BI Tool Dashboard/Report screen to save. The final image for information set within this Dashboard will look like this:
If desired, the Dashboard can be made as the Default to show within the BI Tool Homepage when the BI Tool is opened. See BI Tool Configuration/Data Sources for details.