Dashboard/Edit Reports >
Properties > Components > Grid
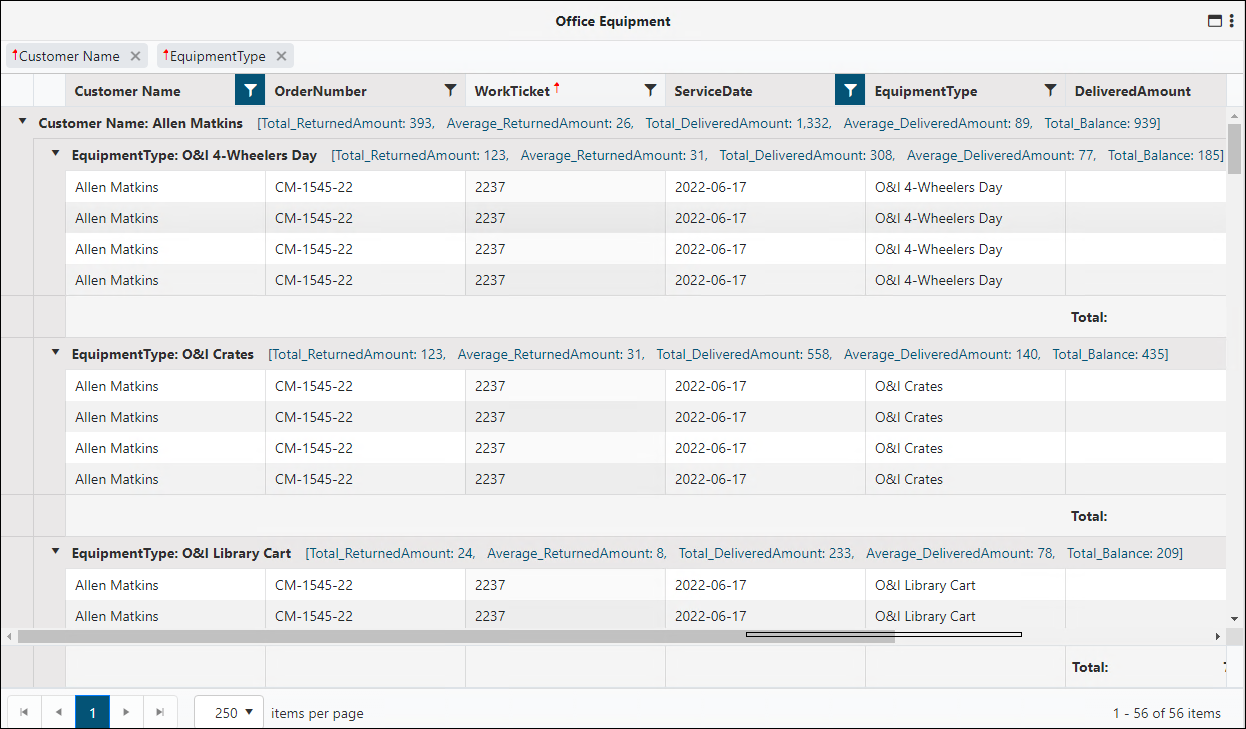
Tabular reports offer the ability to “drilldown” into
the data within multiple columns and the availability to drill down within up to
three levels of detail.
Tabular is also the default Component type when
creating a new report.
Refine Tabular reports by clicking Main Level Settings
button and setting parameters on the Columns, Grouping, Sorting and
Summarize By tabs. Each of these tabs are detailed under BI Tool
Columns Grouping Sorting and Summarize By.
Each column within this view offers filter abilities. Click
the  to further refine
the view. Any changes made to the view will not be saved. This allows for
“drilling down” into the data as needed. The view will only be saved it the Edit
Report pencil is any changes are saved by clicking the check mark on the
Properties page.

Figure 72: Example of a Tabular
report
 to further refine
the view. Any changes made to the view will not be saved. This allows for
“drilling down” into the data as needed. The view will only be saved it the Edit
Report pencil is any changes are saved by clicking the check mark on the
Properties page.