BI Tool > Settings > Administrator > Data Sources and Defaults
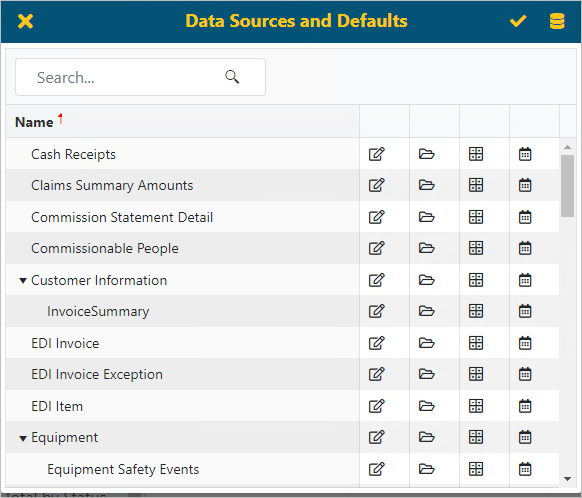
With Administrator access, this screen is used change defaults to allow for customizations, change document attributes, calculations, and schedule caching of Data Sources by using the Data Sources and Defaults screen.
NOTE: BI Tool Configuration/Data Sources is used create a new report or edit an existing report. This is different, though similar in name, to the Data Sources and Defaults screen, which is accessed from Settings.

Figure 26: Data Sources and Defaults screen
Enter text in the search box to find all Data Sources with that text listed under Name. Revenue is entered into the search field in Figure 27 and notice the results all have Revenue in their Name.
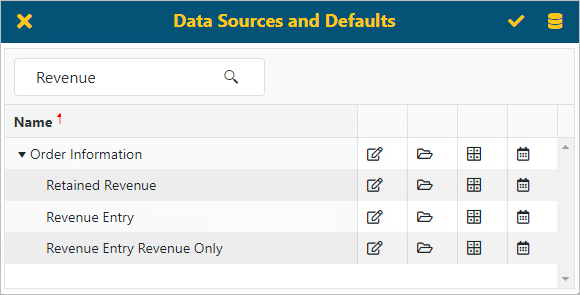
Figure 27: Data Sources and Defaults screen
In the Data Sources and Defaults header, click the Current Queues icon to display the current schedule for updating Data Sources, if any are scheduled.
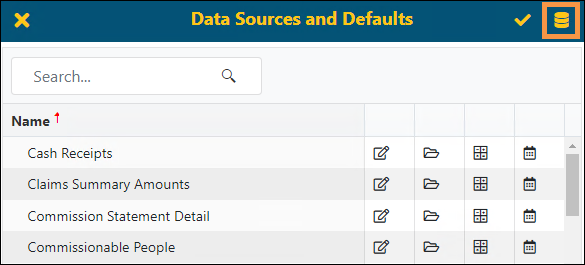

Figure 28: Current Cache Queue screen
When users create a report with View access, the default setting in each of these options available on the Data Sources and Defaults screen will apply to the report. The icons are listed below and include Customizations, Document Attributes, Calculations, and Cache Schedules. Created reports allow users (who have access) to edit and override these settings in the report editor. Only Administrators have rights to change the default settings for Data Source.
The icons indicate the following:
|
|
Customizations |
|
|
Document Attributes |
|
|
Calculations |
|
|
Cache Schedules |
The Customizations icon is used to set defaults for the Column Title, Type and Format.
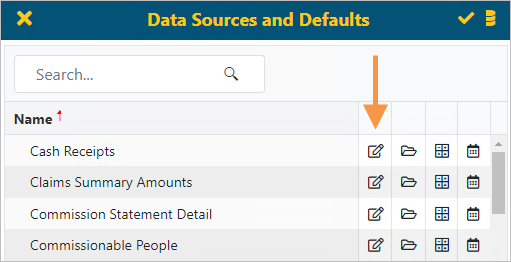
Figure 29: Customizations icon is indicated
Customizations
In the example below (Figure
30) the Customizations icon  on the Data Sources and
Defaults screen was clicked for Cash Receipts (see Figure
29).
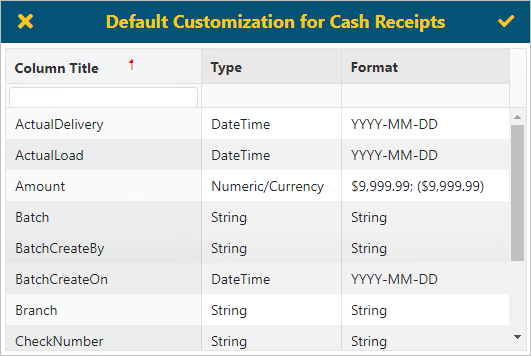
Figure 30: Customization settings vary according to report chosen
Click on a Type or Format to open customization options. In Figure 31, the field listed under Type for ActualDelivery was clicked. Notice the options available. Click a different option if needed.
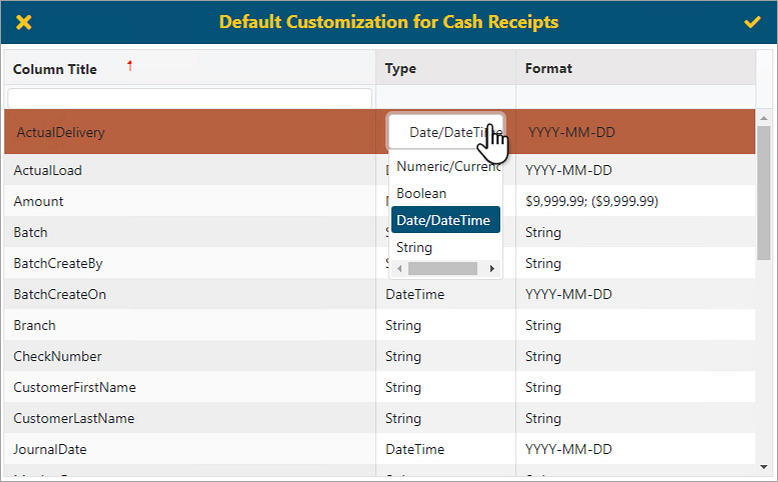
Figure 31: Click a field to open options for that field
Document Attributes
The Document Attributes  icon will default matches between
columns and Jonas Document attributes, used to pull in documents into the bottom
pane of a Report view.
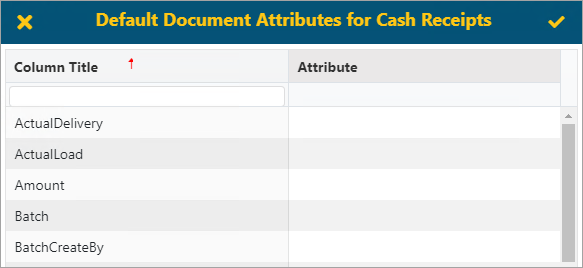
Figure 32: Document Attributes vary according to report chosen
Calculations
The Calculations icon will allow for adding of
calculations for columns used in reports. Click the Calculations  icon to access Default Calculations screen.
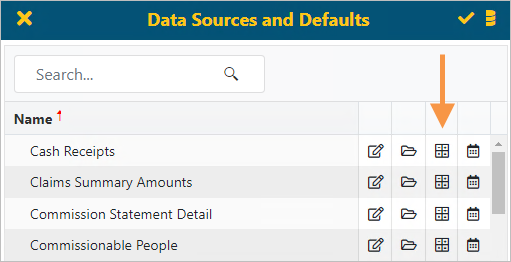
Figure 33: Calculations icon noted
To create a calculation, click the  sign.
sign.
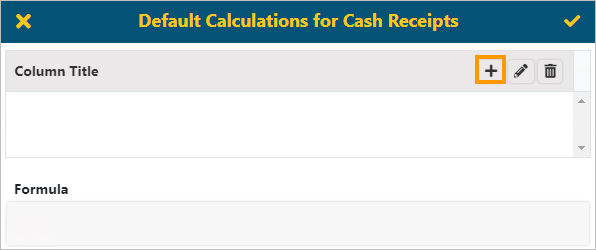
Figure 34: Default Calculations screen example
A Field and Operator must be entered to create a calculation.
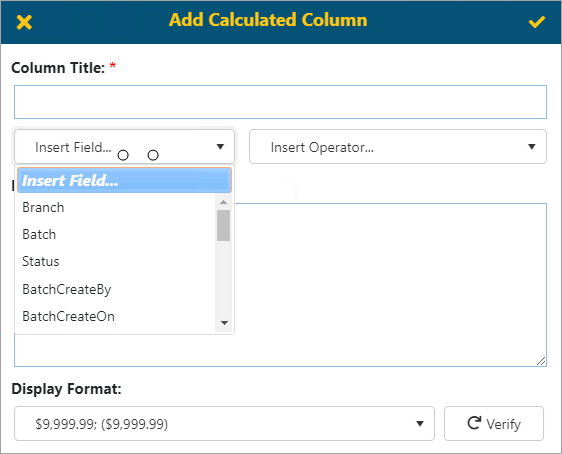
Figure 35: Add Calculated Column Field
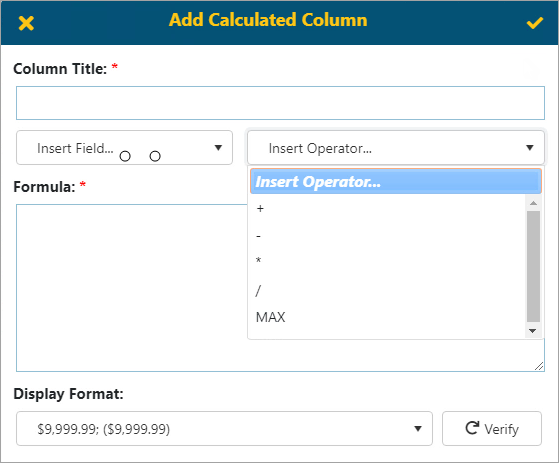
Figure 36: Add Calculated Column Operator
Cache Scheduling
The Cache Scheduling icon allows for setting a schedule to have reports build into cache at a pre-determined time. Using scheduling effectively will dramatically improve performance within the BI Tool. It is best to set schedules based on the likelihood of how these views will be used in reports and when people will likely access them (hourly, daily, monthly etc.). If scheduling is on, the user will have access to rebuild the reporting cache on the fly and will get notice once complete.
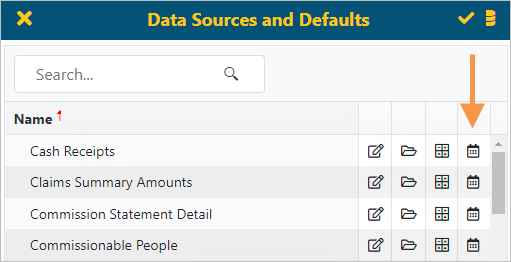
Figure 37: Cache Scheduling icon
Click the Cache Scheduling icon to access a Schedule screen.
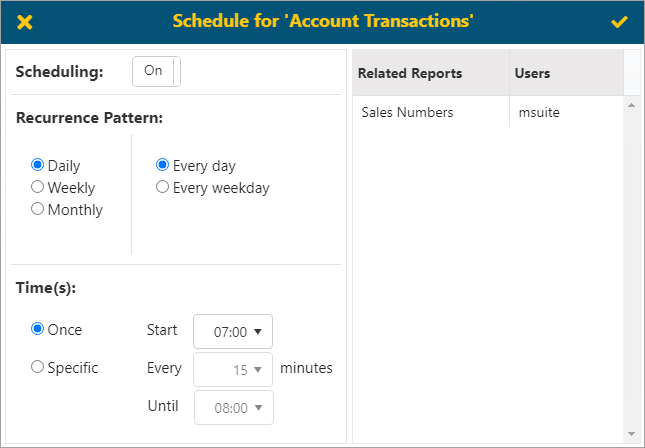
Figure 38: Example of Schedule screen
The reports and users affected by scheduling this Data Source will be show on the right. There are three recurrence patterns: Daily, Weekly, and Monthly.
Daily: The user may select Every Day or Weekday and decide how often the caching happens. When selecting the Specific option, choose the Start time and Until time, as well as the interval time between each caching as shown above.
Weekly: Allows the user to customize the days and times when caching will occur.
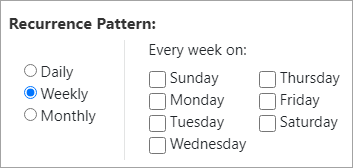
Figure 39: Recurrence Pattern screen with Weekly option chosen
Monthly: The user can specify which day of the month to build the cache either with a specific day of the month, or an interval (i.e., the first Friday of every month). You can also select the time of the day to start building the cache.
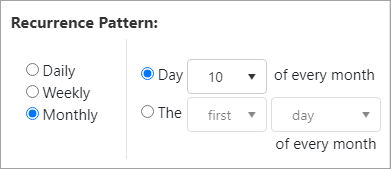
Figure 40: Recurrence Pattern screen with Monthly option chosen