Matrix Settings is accessed by choosing Matrix as the Component on the Properties screen (also reference under Components. Matrix summarizes detailed data, such as transactions into grouping along the rows and columns. Clicking on a value in the matrix will display all the transactions and data that make up the value. See BI Tool Matrix for more information.
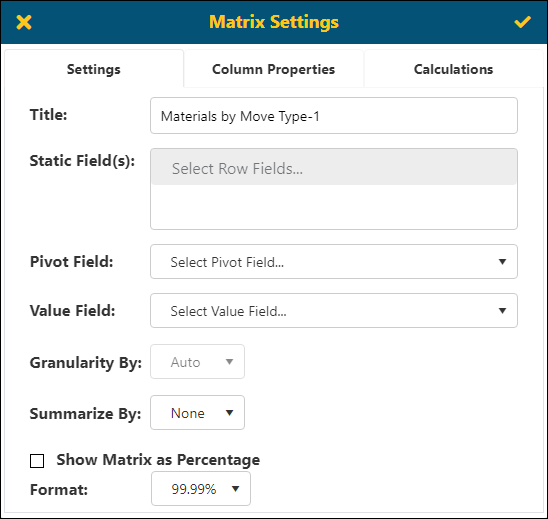
When selecting a Matrix, set the Static Fields (which are row labels), Pivot Field (which is a column label) and the Value Field (the value summarized in each cell.)

Figure 75: Matrix Settings screen
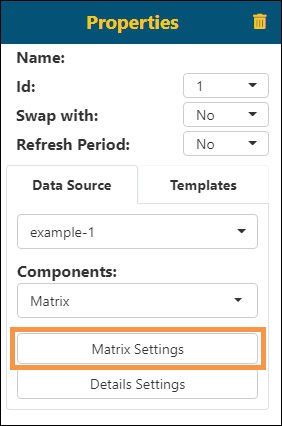
The Matrix Settings screen is accessed by choosing Matrix under Components on the Properties screen, which then prompts the availability of the Matrix Settings button.

Figure 76: Matrix Settings button
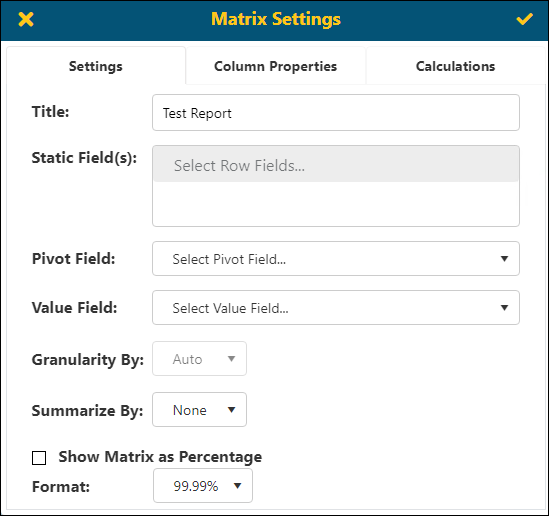
On the Matrix Settings screen, there are three tabs: Settings, Column Properties, and Calculations.

Figure 77: Settings tab on the Matrix Settings screen
Details to note on this tab are:
|
Icon / Field |
Description |
|
|
This will save the report/dashboard. |
|
|
Click to exit out of the Dashboard/Reports Edit screen without saving any of the changes made. This is useful if the user would like to try different Component settings but not save them. |
|
Title: |
Description will be used for title of this component in the report/dashboard |
|
Settings tab | |
|
Static Field(s): |
The fields set will be the row titles in the report. If more than one is needed, click on a title which will add it. Click on the gray area to prompt the list to show again and click on another title to choose that one, too. The options available in the dropdown are determined by the parameters set under BI Tool Configuration/Data Sources. |
|
Pivot Field: |
The field set will be the column titles in the report
NOTE: If you choose a date column as the Pivot Field, then you can choose Auto / Year / Quarter / Month in Granularity By. |
|
Value Field |
This is the value summarized in each cell |
|
Granularity By: |
Aging will allow the user to set Boundaries that will act as columns for the report |
|
Summarize By: |
The option Summarize by will add an extra column at the end of report and calculate the Average or Sum of each column. |
|
|
If Show Matrix as Percentage is selected, then the totals will be shown as percentages of a line total. |
|
Format |
Choose the numerical format that will be used in the report |
|
Column Properties tab | |
|
The Columns Properties tab is where you select the fields that are visible and change the order of the fields in the report. The columns are dynamic based on the data source filters. Click on the Filter to set parameters and further refine the data. | |
|
Calculations tab | |
|
The Calculations tab is where you can create calculations specific to this matrix. The functionality is the same as the Calculations options available for Main on the Data Sources screen. See BI Tool Configuration/Data Sources and the BI Tool Calculations section within that topic to find more details on how to use this functionality. | |
|
Summarize By tab | |
|
See BI Tool Columns Grouping Sorting and Summarize By for details on this feature. | |