Dashboard/Edit Reports > Properties > Components
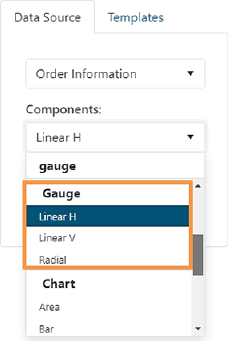
Gauge-type graphs are grouped together within the Components dropdown and include: Linear H, Linear V, and Radial. Choosing Linear H allows users to have the linear gauge display horizontally. Likewise, Linear V allow users to have the linear gauge display vertically. Radial reflects the data in a radial graph.
See BI Tool Radial, BI Tool Linear H, and BI Tool Linear H for more details on each of these Gauge graphs.

Figure 84: Gauge options: Linear H, Linear V, and Radial
NOTE: Choosing a Second and Third setting within BI Tool Data Sources is needed to see a drilldown through the Details when clicking into a Gauge type report.
RELATED INFORMATION:
BI Tool Configuration/Data Sources
BI Tool Dashboard/Report Placement
BI Tool Properties