Dashboard/Edit Reports > Properties > Components > Gauge
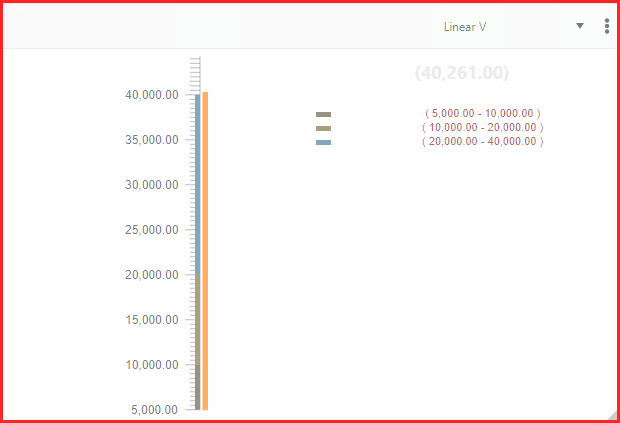
“Linear V” displays data in a vertical format.

Figure 86: Linear V type graph
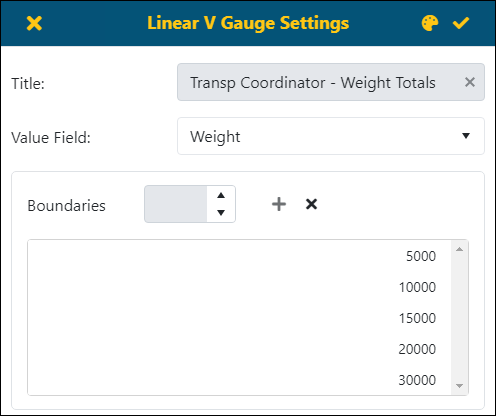
Choosing Linear V prompts the Linear V Settings button, where parameters are set to create a graph, and the Details Settings button, where data can be refined for the graph (see BI Tool Details Settings for more details.) Click the Linear V Settings button to open the Linear H Guage Settings screen, where one value can be set to show on the graph. Click the checkmark to save the settings and create the graph.

Figure 87: Linear V Gauge Settings screen
From this screen, enter the following:
1. Enter a Title.
2. Choose the value used for this graph.
3. Enter the values to be used as the boundary or boundaries for the colors of the graph.
4. Click the checkmark to save the settings.
Use the following table to understand the fields and functions of this screen:
NOTE: Choosing a Second and Third setting within BI Tool Data Sources is needed to see a drilldown through the Details when clicking into a Gauge type report.
|
Icon / Field |
Description |
|
|
This will save the report/dashboard. |
|
|
Click to exit out of the Dashboard/Reports Edit screen without saving any of the changes made. This is useful if the user would like to try different Component settings but not save them. |
|
|
Click to select a Color Theme. See BI Tool Color Themes for details. |
|
Title: |
Description will be used for title of this component in the report/dashboard. |
|
Value Field |
This is the value that is used to create the graph. |
|
Boundaries |
Use this to enter values to be used that group the values using the Color Themes to delineate the boundaries. |
|
|
Enter a value within this field and this value will create a boundary in the graph. Use the + sign to add the value. |
|
|
Click this icon to add the value entered to the boundary list. See above description. |
|
|
To delete a boundary value, highlight the value in the list (detailed below) and this click this icon to delete the value.The value will then be removed from the boundary list. |
|
|
This is referred to in these instructions as the “boundary list.” This list shows the values entered as boundaries for this graph. To delete a value from this list, highlight the value and click the X icon. |
RELATED INFORMATION: