Dashboard/Edit Reports > Properties > Components > List
Within BI Tool Components > List, is the option Top List. Top List is a chart that lists the Top 3, the Top 5, the Top 10 and the Top 20 for the criteria you choose.
When users choose Top List, the view will list based on the criteria selected within Top List Settings.
•If you set a date column as a Pivot Field, then you can choose Auto / Year / Quarter / Month in Granularity By
•User can choose Top 3, 5,10, 20 or All in either ascending or descending order
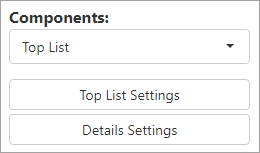
When Top List is chosen as the Component type, the settings needed include Top List Settings and Details Settings. (If needed, BI Tool Details Settings for more details on using the Details Settings button.)

Figure 77: Top List options
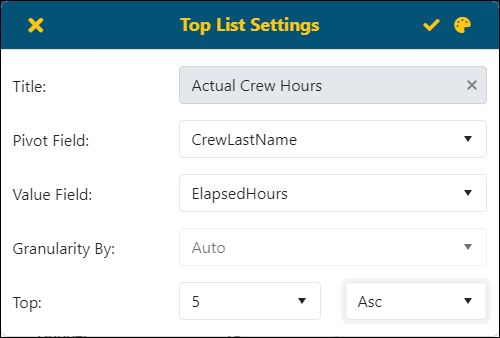
Clicking the Top List Settings button opens the Top List Settings screen.

Figure 78: Top List Settings screen
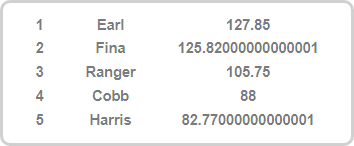
This is what the report looks like with the settings in the image above:

To create this chart:
1. Enter a Title.
2. Choose the Pivot Field.
3. Choose the Value Field.
4. If a date type field is set for Pivot Field, then choose the Granularity By.
5. Select the Top and whether the list is to be ascending or descending.
6. Click the checkmark to save the criteria.
Use the following table to use the Top List Settings screen:
Note: choosing a Second and Third within BI Tool Data Sources is needed to see a drilldown through the Details when clicking into a Top List.
|
Icon / Field |
Description |
|
|
This will save the report/dashboard. |
|
|
Click to exit out of the Dashboard/Reports Edit screen without saving any of the changes made. This is useful if the user would like to try different Component settings but not save them. |
|
Title: |
Description will be used for title of this component in the report/dashboard |
|
Pivot Field: |
The field set will be the criteria used for the Top List. |
|
Value Field |
This is the value that is used to determine the ranking on the Top List. |
|
Granularity By: |
Defaults to Auto unless a date field is chosen under the Pivot Field. |
|
Top: |
Choose from the dropdown how many are included in the list. For example, “5” will list the Top Five in the report.
Choose Asc for Ascending or Desc for Descending, which determines how the items in the list are sorted. |