Dashboard/Edit Reports > Properties > Components > Chart
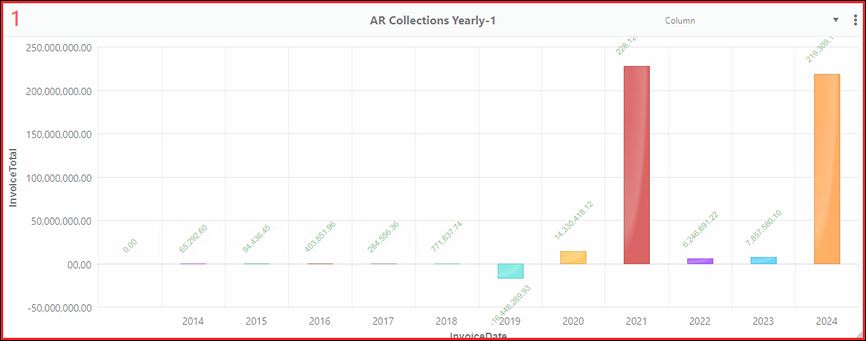
To create a chart such as the one below, choose Column from the Components dropdown. For details on using this option, see BI Tool Chart.

Figure 90: Example of Column type chart
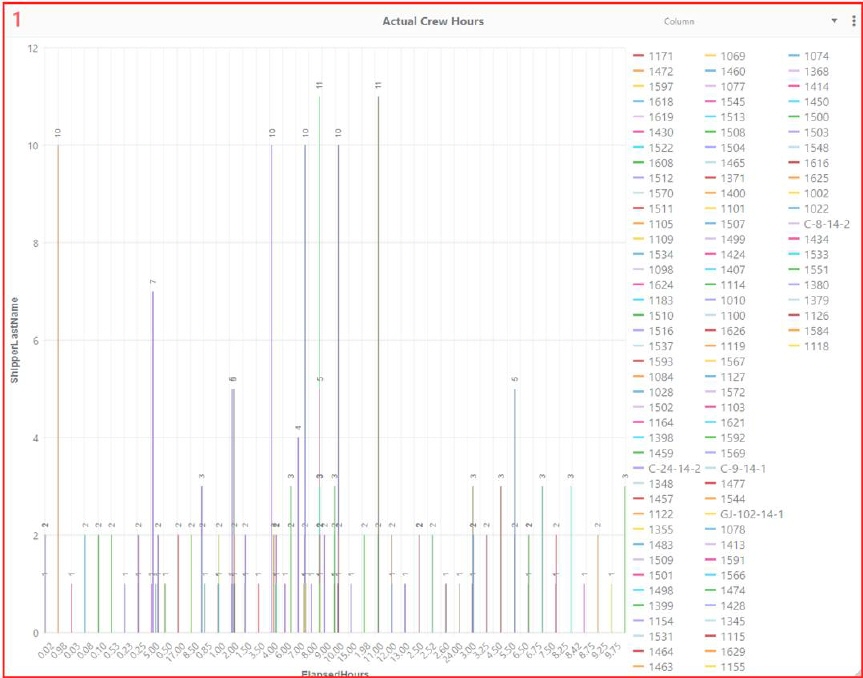
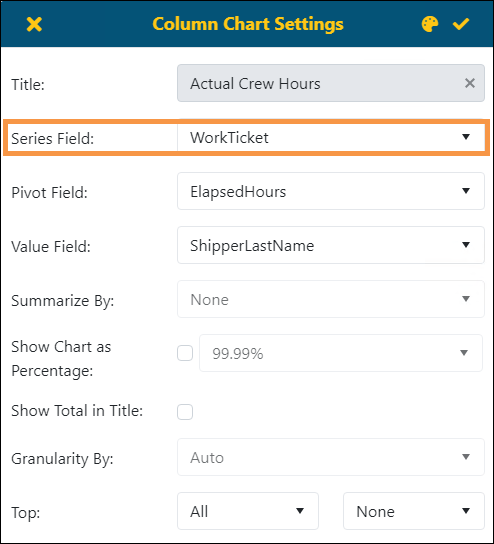
The following image add a setting on the Column Chart Settings screen of Series Field, which has been set to WorkTicket, as shown in >.

Figure 91: Example of Column Chart with Series Field set to WorkTicket

Figure 92: Series Field is set within this screen.