Dashboard/Edit Reports > Properties > Components > Stock Ticker
Stock Ticker is a great tool to use when comparing data over time. For example, if you want to compare Billings year-to-date as compared to last year, this will help you.

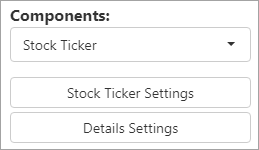
Figure 96: Stock Ticker option
When Stock Ticker is chosen from Components, the options listed include the Stock Ticker Settings and Details Settings. If needed, BI Tool Details Settings for more details on using the Details Settings button.

Figure 97: Stock Ticker options
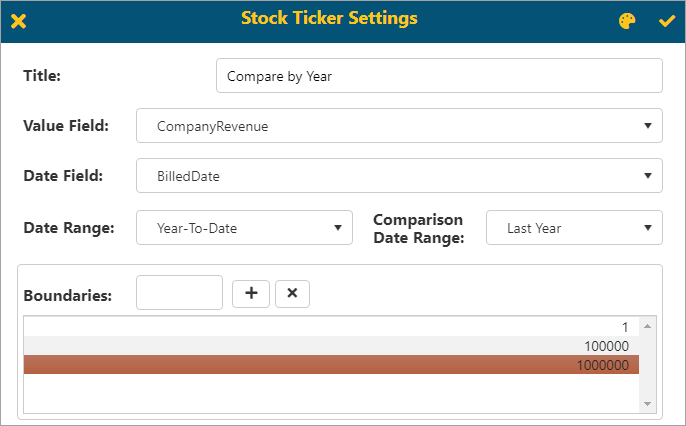
When Stock Ticker is selected, the Stock Ticker Settings screen opens and a Title, Value Field, Date Field, Date Range, and Boundaries can be set. Users can enter one Date Range if they just need a number (i.e., number of new contracts this year). If the difference between two different periods is wanted, then enter both Date Ranges. Users will need to enter the Boundaries values to decide on the colors to display for the boundary range. Click + to save the value. Select a value from the list and click X to remove it. The boundary values are dependent on your report and field value.

Figure 98: Stock Ticker Settings screen