These reports offer multiple columns with the availability to drill through into a value to drill into the details that add to that value. The static columns will freeze allowing the user to scroll to the right to see the details while still seeing the static columns on the left.

Clicking on a value will launch another window with columns from setup.

Matrix summarizes detailed data, such as transactions into grouping, along the rows and columns. When selecting a Matrix, this will allow you to select the Static Fields (which are row labels), Pivot Field (which is a column label) and the Value Field (the value summarized in each cell.)
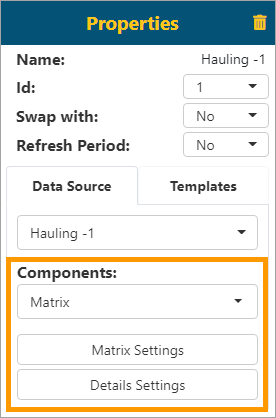
From Dashboard/Edit Reports > Properties > Components, select Matrix. See BI Tool Matrix Settings for details on using this component.

Figure 75: Matrix is chosen as Components