Matrix summarizes detailed data, such as transactions into grouping, along the rows and columns. Clicking on a value in the matrix will display all the transactions and data that make up the value.
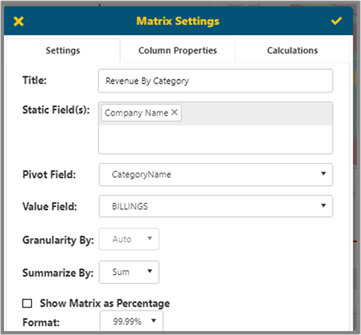
When selecting a Matrix, this will allow you to select the Static Fields (which are row labels), Pivot Field (which is a column label) and the Value Field (the value summarized in each cell.)
§ Title - Description will be used for title of this component in the report/dashboard.
§ If you choose a date column as the Pivot Field, then you can choose Auto / Year / Quarter / Month in Granularity By.
§ The option Summarize by will add an extra column at the end of report and calculate the Average or Sum of each column.
§ If Show Matrix as Percentage is selected, then the totals will be shown as percentages of a line total.