Once a report/dashboard is selected from the menu on the left, the report / dashboard will display.
With each release, check the Templates folder as it is updated with new and/or updated reports/dashboards.
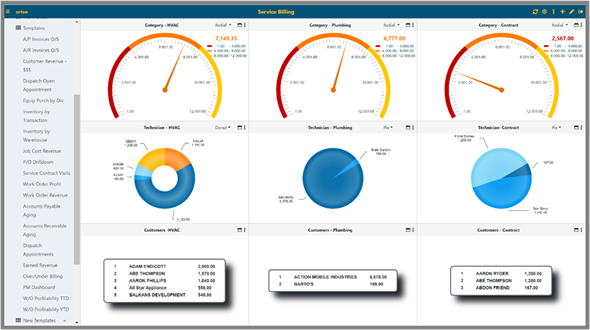
The screen will show up to seventy-two sections consisting of component types Report (Tabular or Matrix), Graph, Gauge, Top List, Stock Ticker or Web Link.
The Icons on the right side on the main screen have various effects on the report/dashboard shown on the screen.
§ Clicking on the  icon will refresh the report and/or
dashboard.
icon will refresh the report and/or
dashboard.
§ Clicking on the icon  will display a drop-down list with
various options to export, delete reports or dashboards. You can also take a
snapshot or rebuild the report cache.
will display a drop-down list with
various options to export, delete reports or dashboards. You can also take a
snapshot or rebuild the report cache.
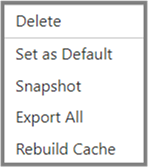
§ ‘Delete’ will delete the report and/or dashboard.
§ ‘Set as Default’ will set this report/dashboard to display when you log in to the BI Tool and as the dashboard in the ‘Jonas Enterprise’ menu.
§ ‘Snapshot’ will take a screen shot of the screen with the report/dashboards elements as you see them. It will then export it to a PDF.
§ ‘Export All’ will export the reporting, graphical components to Excel and/or PDF dependent on type and amount of data.
§ ‘Rebuild Cache’ will rebuild cache for all views that are used in this report/dashboard and will let you know this task is scheduled. Users will get a message once the report/dashboard is updated and ready to be viewed (NOTE: this option is only available for views that have been scheduled by an Administrator.)