, this will allow the user to choose or
customize a theme for this report/dashboard. Please refer to the Color
Themes section to learn how to use this feature.
, this will allow the user to choose or
customize a theme for this report/dashboard. Please refer to the Color
Themes section to learn how to use this feature.
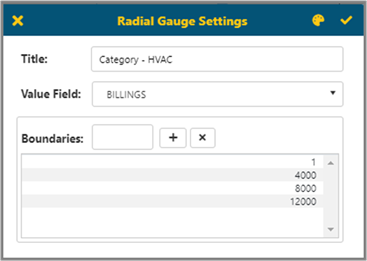
When users choose Gauge, there are two options of graph: Linear or Radial.
Users need to enter the boundary values in Gauge and will need to enter at least two values to build the graph successfully. Input the value in the Input box and click Add to save the value. Select a value from the list and click Remove to delete it. The boundary values are dependent on your report and field value.
NOTE: Choosing the option Vertical will allow users to have the linear gauge display vertically.
Top right corner has a Color Themes icon , this will allow the user to choose or
customize a theme for this report/dashboard. Please refer to the Color
Themes section to learn how to use this feature.